ECOISM SingaporeECOISMSINGAPORE
Home Energy AI Food Company News Partner with us
Energy · ESP / ESS

Your cooling bill is now a regulated risk.

Tariffs, carbon tax and Singapore's new mandatory energy audit have turned 'business as usual' cooling into a compliance problem. ECOISM cuts it — without replacing your equipment — and hands you data that survives an audit.

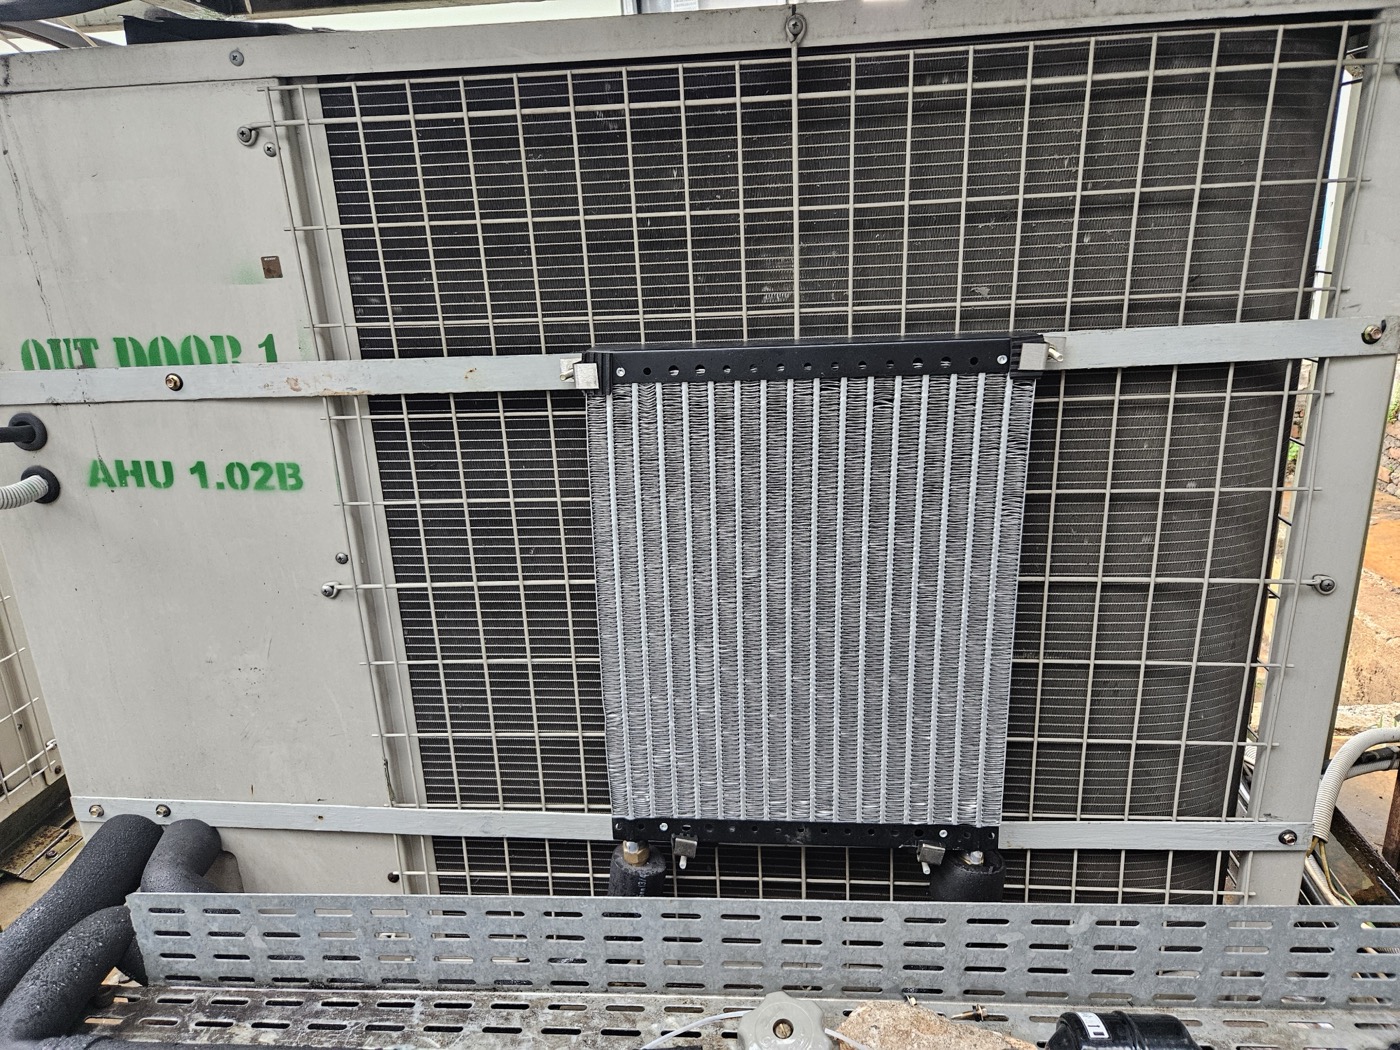
Live ESP panel retrofitted onto an existing condenser
Scroll
01The demand

The pressure on cooling is now external — and rising.

Four forces are pushing the cost of cooling up at the same time. None of them are optional any more.

The cost of cooling keeps climbing.

Carbon tax per tonne, with the electricity tariff alongside — both trending up through 2030.
0 40 80 S$25 S$45 S$50–80 2024–25 2026–27 2030 target Carbon tax · S$ per tonne CO₂e Carbon tax: SP Group / NCCS (S$25 → S$45 → S$50–80 target). Electricity tariff: 27.27¢/kWh (2026 Q2); SME spot > S$0.30/kWh (SP Group).
Electricity stays high

Regulated tariff 27.27¢ / 29.72¢ per kWh (2026 Q2); SME spot rates pass S$0.30/kWh.

Source: SP Group, tariff revision Apr–Jun 2026.
Carbon tax climbing

From S$25/t (2024–25) to S$45/t (2026–27), targeting S$50–80/t by 2030.

Source: SP Group / NCCS.
Energy audits are mandatory

Since Sept 2025, BCA's MEI rule requires energy-intensive existing buildings to audit and improve — with verifiable data.

Source: BCA / Baker McKenzie Resource Hub.
Green Mark targets

80% of building stock to be Green Mark certified by 2030 — certified stock targets ~S$1.3B / 4.2B kWh saved.

Source: BCA / FOZL.
02The proof

Measured savings. No equipment change.

Conservative, audit-ready numbers from real deployments — exactly the "verifiable data" MEI and Green Mark ask for.
⟳ Retrofit only — your chillers and condensers stay in place.
22.23%ESS averageESP + refrigerant set
11.18%ESP averagePanel only · conservative range
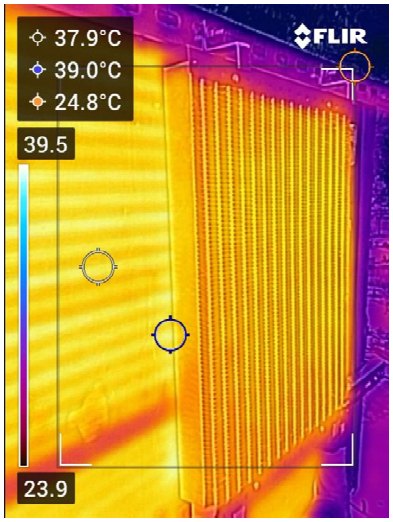
FLIR · same-condition measurement FLIR thermal image of an ESP panel on a condenser (37.9 / 39.0 / 24.8 °C)
Thermal imaging on a live retrofit — readings normalised to a lower-bound result.

Every PoC result · 3 countries · DAIKIN & Casper

ESS — panel + refrigerantaverage22.23%
Site A · SupermarketESS · 20 HP · DAIKIN VRV-X
26.50%
Site B · SupermarketESS · 10 HP · DAIKIN VRV-A
21.85%
Site C · Pharma plantESS · 8 HP · DAIKIN Ducted Split-H
25.30%
Site D · OfficeESS · 4 HP · DAIKIN Homes
24.73%
Site E · SupermarketESS · 12 HP · DAIKIN VRV-Ⅲ
18.53%
Site F · HospitalESS · 12 HP · DAIKIN VRV-Ⅲ
16.45%
ESP — panel onlyaverage11.18%
Site G · Factory (medical)ESP · 8 HP · DAIKIN SkyAir
13.03%
Site H · Factory (industrial)ESP · 4 HP · DAIKIN (older · R22)
12.50%
Site I · RestaurantESP · 5.5 HP · Casper (R32)
10.50%
Site J · RestaurantESP · 4 HP · Casper (R410a)
8.70%

Teal = ESS (panel + refrigerant), average 22.23% · grey = ESP (panel only), average 11.18%. Group averages across all PoC measurements (case simple average). Re-verified site (Site B) is shown at the case average of matched-condition 27.4% and all-condition 16.3% (=21.85%); the case card keeps 27.4%. Tested on DAIKIN & Casper equipment; client names, store names and countries withheld. Figures are corrected lower bounds.

Site C · Before1,693.5kWh metered
−25.3%*
Site C · After1,253.9kWh (corrected)
Site A · Customer meter26.5%12-hour total
Site B · Re-verified27.4%matched condition band

*Site C pharmaceutical plant, metered kWh 1,693.5 → 1,253.9 (26.0%, corrected 25.3%). Outdoor temperature was slightly lower after install (favourable) and corrected via the cooling-characteristic table; humidity rose (unfavourable) — the reduction held. Daytime high-speed band reached 30.9%; nights −10.4% — reported value is the corrected lower bound.

The harder it works, the more it saves.

Site A · customer-meter, reduction by operating band
0 Night −10.4% Day +30.9% 12-h total 26.5% customer-meter · ESP/ESS works hardest in the high-load band.

Reduction by system type — ESP vs ESS

Each point = one PoC site (matched-condition reduction); lines = group averages
0 10 20 30% avg 11.18% avg 22.23% ESP panel only · 4 sites ESS panel + refrigerant · 6 sites each point = one PoC site (matched-condition reduction); lines = group averages.
Deployment

From validation to deployment.

Following the PoC results, a major supermarket chain is rolling ESS out across its stores.

2025Completed
Stores D · E · F — 3 stores · ESS
19ESP panels
33.1kgrefrigerant
2026In progress
Stores G · H — 2 stores · ESS
48ESP panels
78.0kgrefrigerant

"Stores" are rollout locations, distinct from the anonymous PoC "Sites" above. Client and store names withheld.
5.0 MPa
Held 24h, no anomaly (ITST)
11.0 MPa
Burst · safety factor 2.2
0
Corrosion under salt-spray

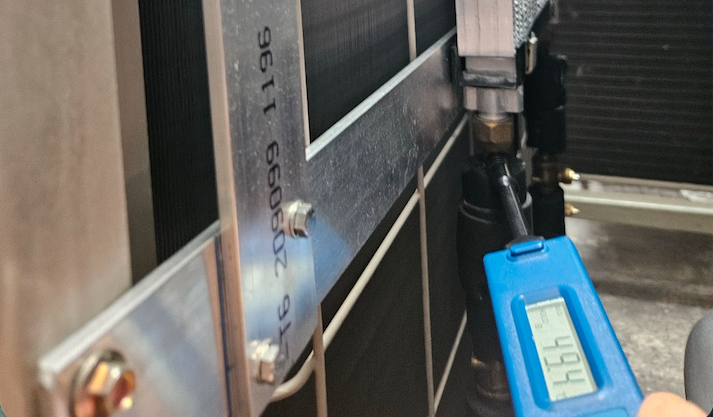
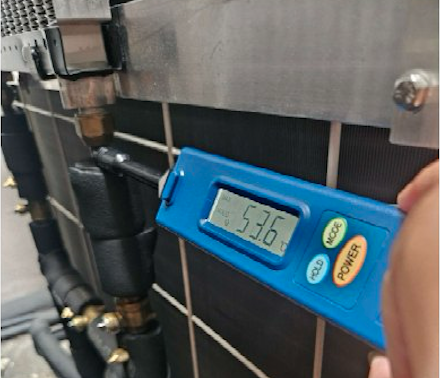
Refrigerant temperature, measured across the panel

ESP-IN · BEFORE PANELRefrigerant temperature 53.6 °C before the ESP panel53.6°C
ESP-In · refrigerant before the panel
ESP-OUT · AFTER PANELRefrigerant temperature 49.4 °C after the ESP panel49.4°C
ESP-Out · refrigerant after the panel
53.6 °C → 49.4 °C  ·  −4.2 °C across the panel
Why power varies

Three factors decide air-conditioning power.

To measure savings correctly, you first have to hold these constant. Compare periods where they differ and the effect disappears into weather and occupancy noise.

01 · Outdoor temperature — Condenser heat rejection

Higher outdoor temperatures make heat rejection at the condenser harder, raising pipe pressure and pushing compressor run-rate — and power — up.

02 · Indoor heat load — People · lighting · equipment

The more heat from occupancy, lighting and kitchens, the closer the system runs to full load. Near-empty rooms run at low speed.

03 · Indoor humidity — Latent load

Humid air takes more energy to cool (latent load). We derive relative humidity from dry-bulb and dew point and align the difference between compared periods.

How it works

Less compressor work, same cooling.

ESP is a heat-exchange panel bolted to an existing condenser; ESS adds a matched refrigerant. Neither replaces the unit.

1

Sub-cool the liquid

After condensing, the liquid refrigerant is sub-cooled a further 3–5 °C.

2

Lower the flow

The same cooling now needs less refrigerant mass-flow (ṁ).

3

Cut compressor work

Compressor power W = ṁ × (h₂ − h₁) falls — that's the saving.

Side benefits, at the same time

  • Improved cooling efficiency (Δt)
  • Fewer indoor units running
  • Room to relax setpoints
  • Bigger effect at high load
  • Lower CO₂ emissions

These side benefits are not counted in the reported reductions — so the figures stay on the conservative side.
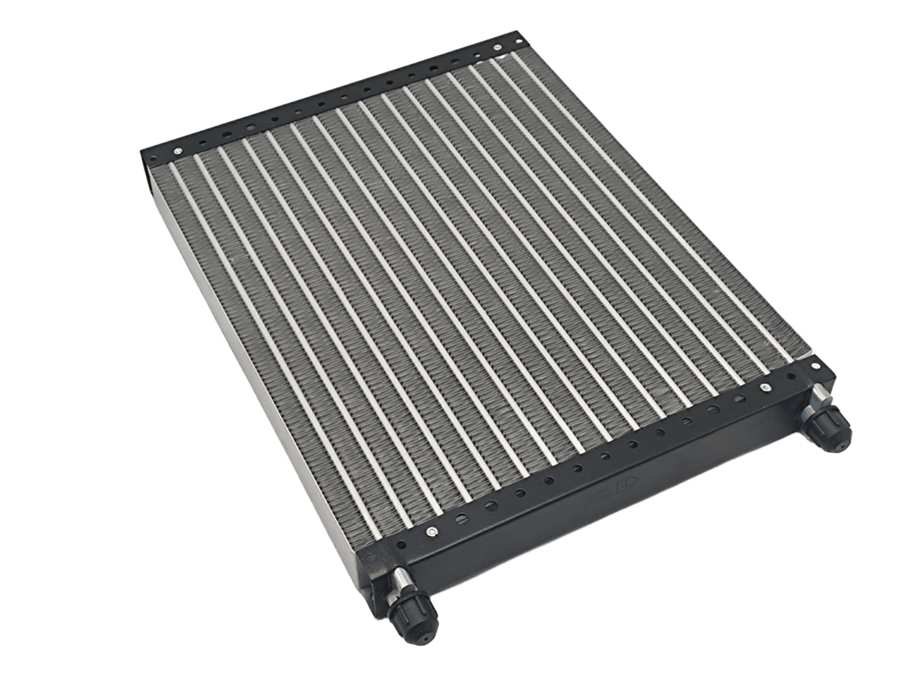
ESP panel ESP heat-exchange panel (product)
The ESP heat-exchange panel — the part that does the work.
Methodology

Why "same-condition comparison" matters.

A naïve before/after can't tell whether a difference is the ESP/ESS effect or just weather and crowding. Only after aligning temperature, humidity and time of day can a change in power be attributed to the technology.

01 · Same time of day

Indoor heat load varies predictably by hour, so we compare before/after data from the same time slots — holding heat load roughly constant.

02 · Outdoor-temp gap ≤ 5%

Among same-hour data, we accept only pairs whose outdoor-temperature difference is within about 5%.

03 · Indoor-humidity gap ≤ 5%

Relative humidity from dry-bulb and dew point; we accept pairs within about 5% humidity difference.

04 · Residual correction

Tiny remaining temp/humidity gaps are normalised with the DAIKIN cooling-characteristic table. Data selection and residual correction play different roles — this is not double-counting.

Favourable conditions are corrected or excluded and side-savings (fewer running units, relaxed setpoints) are not counted — so every reported figure is a transparent, reproducible, audit-ready lower bound. Measured with HIOKI temperature/humidity and current loggers.

Case studies

Four sites, in detail.

Measurement method and conclusion for four of the PoCs above. Equipment and capacity are real; only confidential contract figures are withheld.

Case 1 · Customer meter

Site A — objective customer-meter check

Supermarket · DAIKIN VRV-X (20 HP)
26.5%
12-hour total

ESS applied to a DAIKIN VRV-X 20HP, reconciled against the customer's own electricity meter. Analysis by operating band, with same-hour data and ±5% temperature/humidity windows.

Post-install low outdoor temperatures were corrected as unfavourable; high humidity was excluded as favourable (both conservative). ESP/ESS works hardest in the high-speed, high-load band — so the low-load night band came out unfavourable here.
Schedule: Install 2024-11-14 · Before 2024-10-23–30 · After 2024-11-15–19
Reduction by operating band
BandReduction
Low-speed (night)−10.4%
High-speed (day)30.9%
12-hour total26.5%
Case 2 · Robust re-verification

Site B — re-verified through an existing fault

Supermarket · DAIKIN VRV-A (10 HP)
27.4%
matched-condition hours

During ESP installation, a serious pre-existing fault on the customer side surfaced. The procedure was re-planned to isolate the ESP effect: a 10HP outdoor unit was run alone, with other units excluded at the distribution board.

Pre-existing faults found: (1) refrigerant leak inside the outdoor unit; (2) poor refrigerant quality (a third-party lab detected moisture and impurities). Pre-install data — taken while the AC was not operating normally — was judged unusable; re-verification followed refrigerant normalisation.
Schedule: Install 2024-12-16–18 · Verification 2025-02-19–21
Reduction by comparison condition
ConditionReduction
Matched conditions — same temp & room-hours27.4%
All-condition average16.3%

Pre-install setpoints of 18–19 °C were excessively low; after install, relaxing to 23 °C drew no complaints.

Case 3 · kWh-metered

Site C — pharmaceutical plant (most rigorous)

Pharma plant · DAIKIN Ducted Split-H (8 HP) — computed directly from kWh
25.3%
after correction

8HP (DAIKIN Ducted Split-H, ESS). Before/after compared under identical conditions, with the reduction computed directly from metered energy (kWh) — the most quantitatively rigorous case in this set.

Matched-condition energy: 1,693.5 kWh before → 1,253.9 kWh after. Measured reduction = 1 − (1,253.9 / 1,693.5) = 26.0%; after correction = 25.3%. Post-install was 1.1 °C cooler (favourable), discounted by the maker's capacity-coefficient ratio. Even with unfavourable higher humidity, kWh still showed 26.0% — confirming robustness.
Before / after (official value is kWh-based)
ItemBeforeAfter
Energy (kWh)1,693.51,253.9
Outdoor current (A)4.43.3
Outdoor temp (°C)29.027.9
Humidity (%) — ↑ unfavourable72.976.2
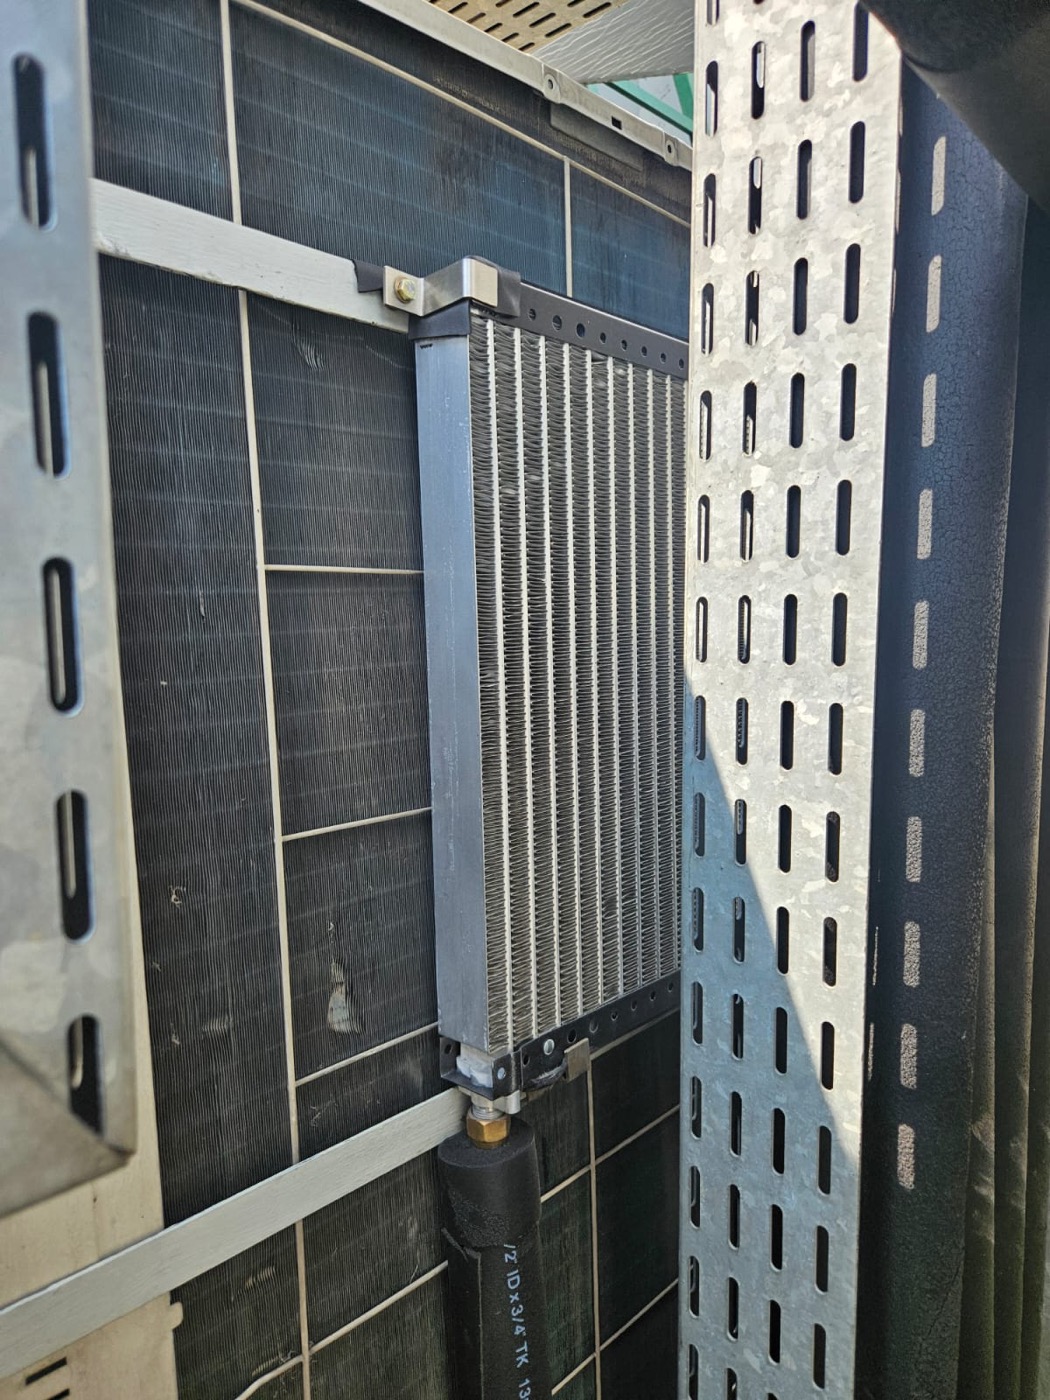
ESP heat-exchange panel installed on the rooftop condenser at this site
ESP panel installed on the rooftop condenser (this site).
ESP heat-exchange panel fitted to the condenser front at this site
ESP panel fitted to the condenser front (this site).
Schedule: ESS Basic 2025-05-08–15 · After 2025-05-15–21
More verified PoCs. The remaining proof-of-concepts, each measured under matched conditions. Facts only — equipment, capacity, refrigerant and reduction. Client names, store names and countries are withheld.
Case 4 · Matched-condition

Site D — office

DAIKIN Homes · 4 HP · R410a
24.73%
matched-condition

ESS (panel + matched refrigerant) on an existing 4 HP DAIKIN Homes unit; reduction measured under matched conditions.

Verified reduction
BasisReduction
Matched-condition result24.73%
Schedule: Basic 2025-03-11–15 · After 2025-04-07–12
Case 5 · Matched-condition

Site E — supermarket

DAIKIN VRV-Ⅲ · 12 HP · R410a
18.53%
matched-condition

ESS (panel + matched refrigerant) on an existing 12 HP DAIKIN VRV-Ⅲ; reduction measured under matched conditions.

Verified reduction
BasisReduction
Matched-condition result18.53%
Schedule: Basic 2023-09-25–27 · ESS applied 2024-03-14
Case 6 · Matched-condition

Site F — hospital

DAIKIN VRV-Ⅲ · 10–12 HP · R410a
16.45%
matched-condition

ESS (panel + matched refrigerant) on an existing 10–12 HP DAIKIN VRV-Ⅲ; reduction measured under matched conditions.

Verified reduction
BasisReduction
Matched-condition result16.45%
Schedule: Survey 2023-11–12 · Before 2023-11-09–14 · Install/After 2023-12-02–07
Case 7 · Matched-condition

Site G — factory (medical)

DAIKIN SkyAir · 8 HP · R410a
13.03%
matched-condition

ESP (panel only) on an existing 8 HP DAIKIN SkyAir unit; reduction measured under matched conditions.

Verified reduction
BasisReduction
Matched-condition result13.03%
Schedule: Basic 2025-02-24–28 · After –2025-03-04
Case 8 · Matched-condition

Site H — factory (industrial)

DAIKIN (older · R22) · 4 HP · R22
12.50%
matched-condition

ESP (panel only) on an existing 4 HP DAIKIN unit (older, R22); reduction measured under matched conditions.

Detailed data for this case is withheld under a client NDA; only the ledger figure (12.5%) is shown.
Verified reduction
BasisReduction
Matched-condition result12.50%
Schedule: NDA — dates withheld
Case 9 · Matched-condition

Site I — restaurant

Casper · 5.5 HP · R32
10.50%
matched-condition

ESP (panel only) on an existing 5.5 HP Casper unit (R32); reduction measured under matched conditions.

Verified reduction
BasisReduction
Matched-condition result10.50%
Schedule: Basic 2024-07-09–12 · ESP applied 2024-07-15–16
Case 10 · Matched-condition

Site J — restaurant

Casper · 4 HP · R410a
8.70%
matched-condition

ESP (panel only) on an existing 4 HP Casper unit (R410a); reduction measured under matched conditions.

Verified reduction
BasisReduction
Matched-condition result8.70%
Schedule: Basic 2024-07-09–12 · ESP applied 2024-07-15–16
Why it convinces

Four reasons the result holds up.

01 · Repeatable

Across different stores, capacities (10/16/20HP), countries and seasons, ESS stays in the 20% class (average 22.23%) — not tied to one environment.

02 · Transparent

Same-condition comparison plus characteristic-table residual correction make the results transparent, reproducible and audit-ready.

03 · Conservative

Favourable conditions are corrected or excluded; secondary savings from run-rate and setpoints are not counted. Based on third-party / customer data.

04 · Added value

Better Δt means fewer running units, relaxed setpoints and CO₂ reduction. As a large electricity load, a ~20% cut has a sizeable CO₂ impact.

The fine print, up front

What you're installing — and the honest caveats.

ESP
Bolt-on heat-exchange panel for an existing condenser (retrofit)
ESS
ESP + matched refrigerant replacement (full set)
Equipment change
None — the original unit stays
Third-party safety
ITST: 5.0 MPa / 24h; burst 11.0 MPa (SF 2.2); no salt-spray corrosion
Verification
Same-condition ±5%, normalised; reported as lower bound
Track record
First ESS since Mar 2024 — no serious faults to date
Please read before you expect a number.

All verification units were existing machines in service 3+ years — a brand-new unit will not necessarily see ~20%.

Under manufacturer terms, fitting ESP/ESS counts as a modified machine, so the maker's warranty no longer applies. We therefore recommend units already past their warranty period.

1

Survey

On-site assessment

2

Proposal

Scope & targets

3

PoC

Measured trial

4

Report

Audit-ready data

5

Roll out

Full deployment

Q & A

Key questions, answered.

What's the difference between ESP and ESS?
ESP is a heat-exchange panel retrofitted to the existing outdoor unit; ESS adds dedicated-refrigerant replacement on top. Both are retrofit technologies that keep the original equipment.
Really ~20% without buying new?
Computed from same-condition comparison plus table correction, as a lower bound after removing favourable conditions (ESS average 22.23%). Note: all test machines were 3+ years in service; results on brand-new equipment won't necessarily match ~20%.
How much does the ESP panel alone do?
ESP (panel only) averages 11.18% in current real-machine tests — about 8.7–13% per site (R410a / R32). ESS, including dedicated refrigerant, averages 22.23%.
Are these your own numbers? Third-party?
Site A used the customer's own electricity meter; Site B's refrigerant quality was assessed by a third-party lab. The figures rest on third-party or customer-side measurement — not seller-only data.
Any impact on manufacturer warranty?
ESP/ESS counts as a "modified unit" and is outside maker warranty, so we recommend installing on equipment past its warranty period. The first ESS install (March 2024) has run to mid-2026 with no serious issues.
Are side benefits included in the figure?
No. Reported reductions reflect only compressor power; run-rate and setpoint savings are excluded. Side benefits sit outside the reported figure — the bias is toward understatement.
How should we read annualised savings?
The effect is larger at high load, so annual figures depend on the share of high-load hours. In the tropics, high load dominates and ~26.5% (12-hour total) is representative; four-season regions may see lower annual values.
Is the ESP panel pressure-safe?
Third-party testing (ITST): held 5.0 MPa for 24 hours with no abnormality, burst at 11.0 MPa (safety factor 2.2), and no corrosion under salt spray.
03Who it's for

Built for buildings that can't switch off.

A no-replacement retrofit suits operations where downtime and capital are both expensive.

Hotels
24/7 comfort load
Malls
Large floor cooling
Offices
Green Mark drive
Factories
Process cooling
F&B
Cold chain & AC
Return on investment

The longer it runs, the more it saves.

<2yrstypical payback for always-on sites

Indicative — the exact figure is verified per site in the PoC.

How the saving compounds
  1. Cooling runs 24/7Always-on load, every hour of the day.
  2. More operating hours savedEach hour of runtime adds to the cut.
  3. Faster payback on the retrofitSavings recover the cost sooner.

See the verification data for your building.

Book a proof-of-concept, or request the audit-ready dataset behind every number.

The other two costs

Same discipline, different demand.